


.png)

Bitcoin Mining Insights is a collection of tools and stats built by Braiins to help Bitcoin miners.
Industry leaders in transparency and innovation, with more than 1.25 million BTC mined since 2010.
Braiins Pool is operated by Braiins Mining Ltd.
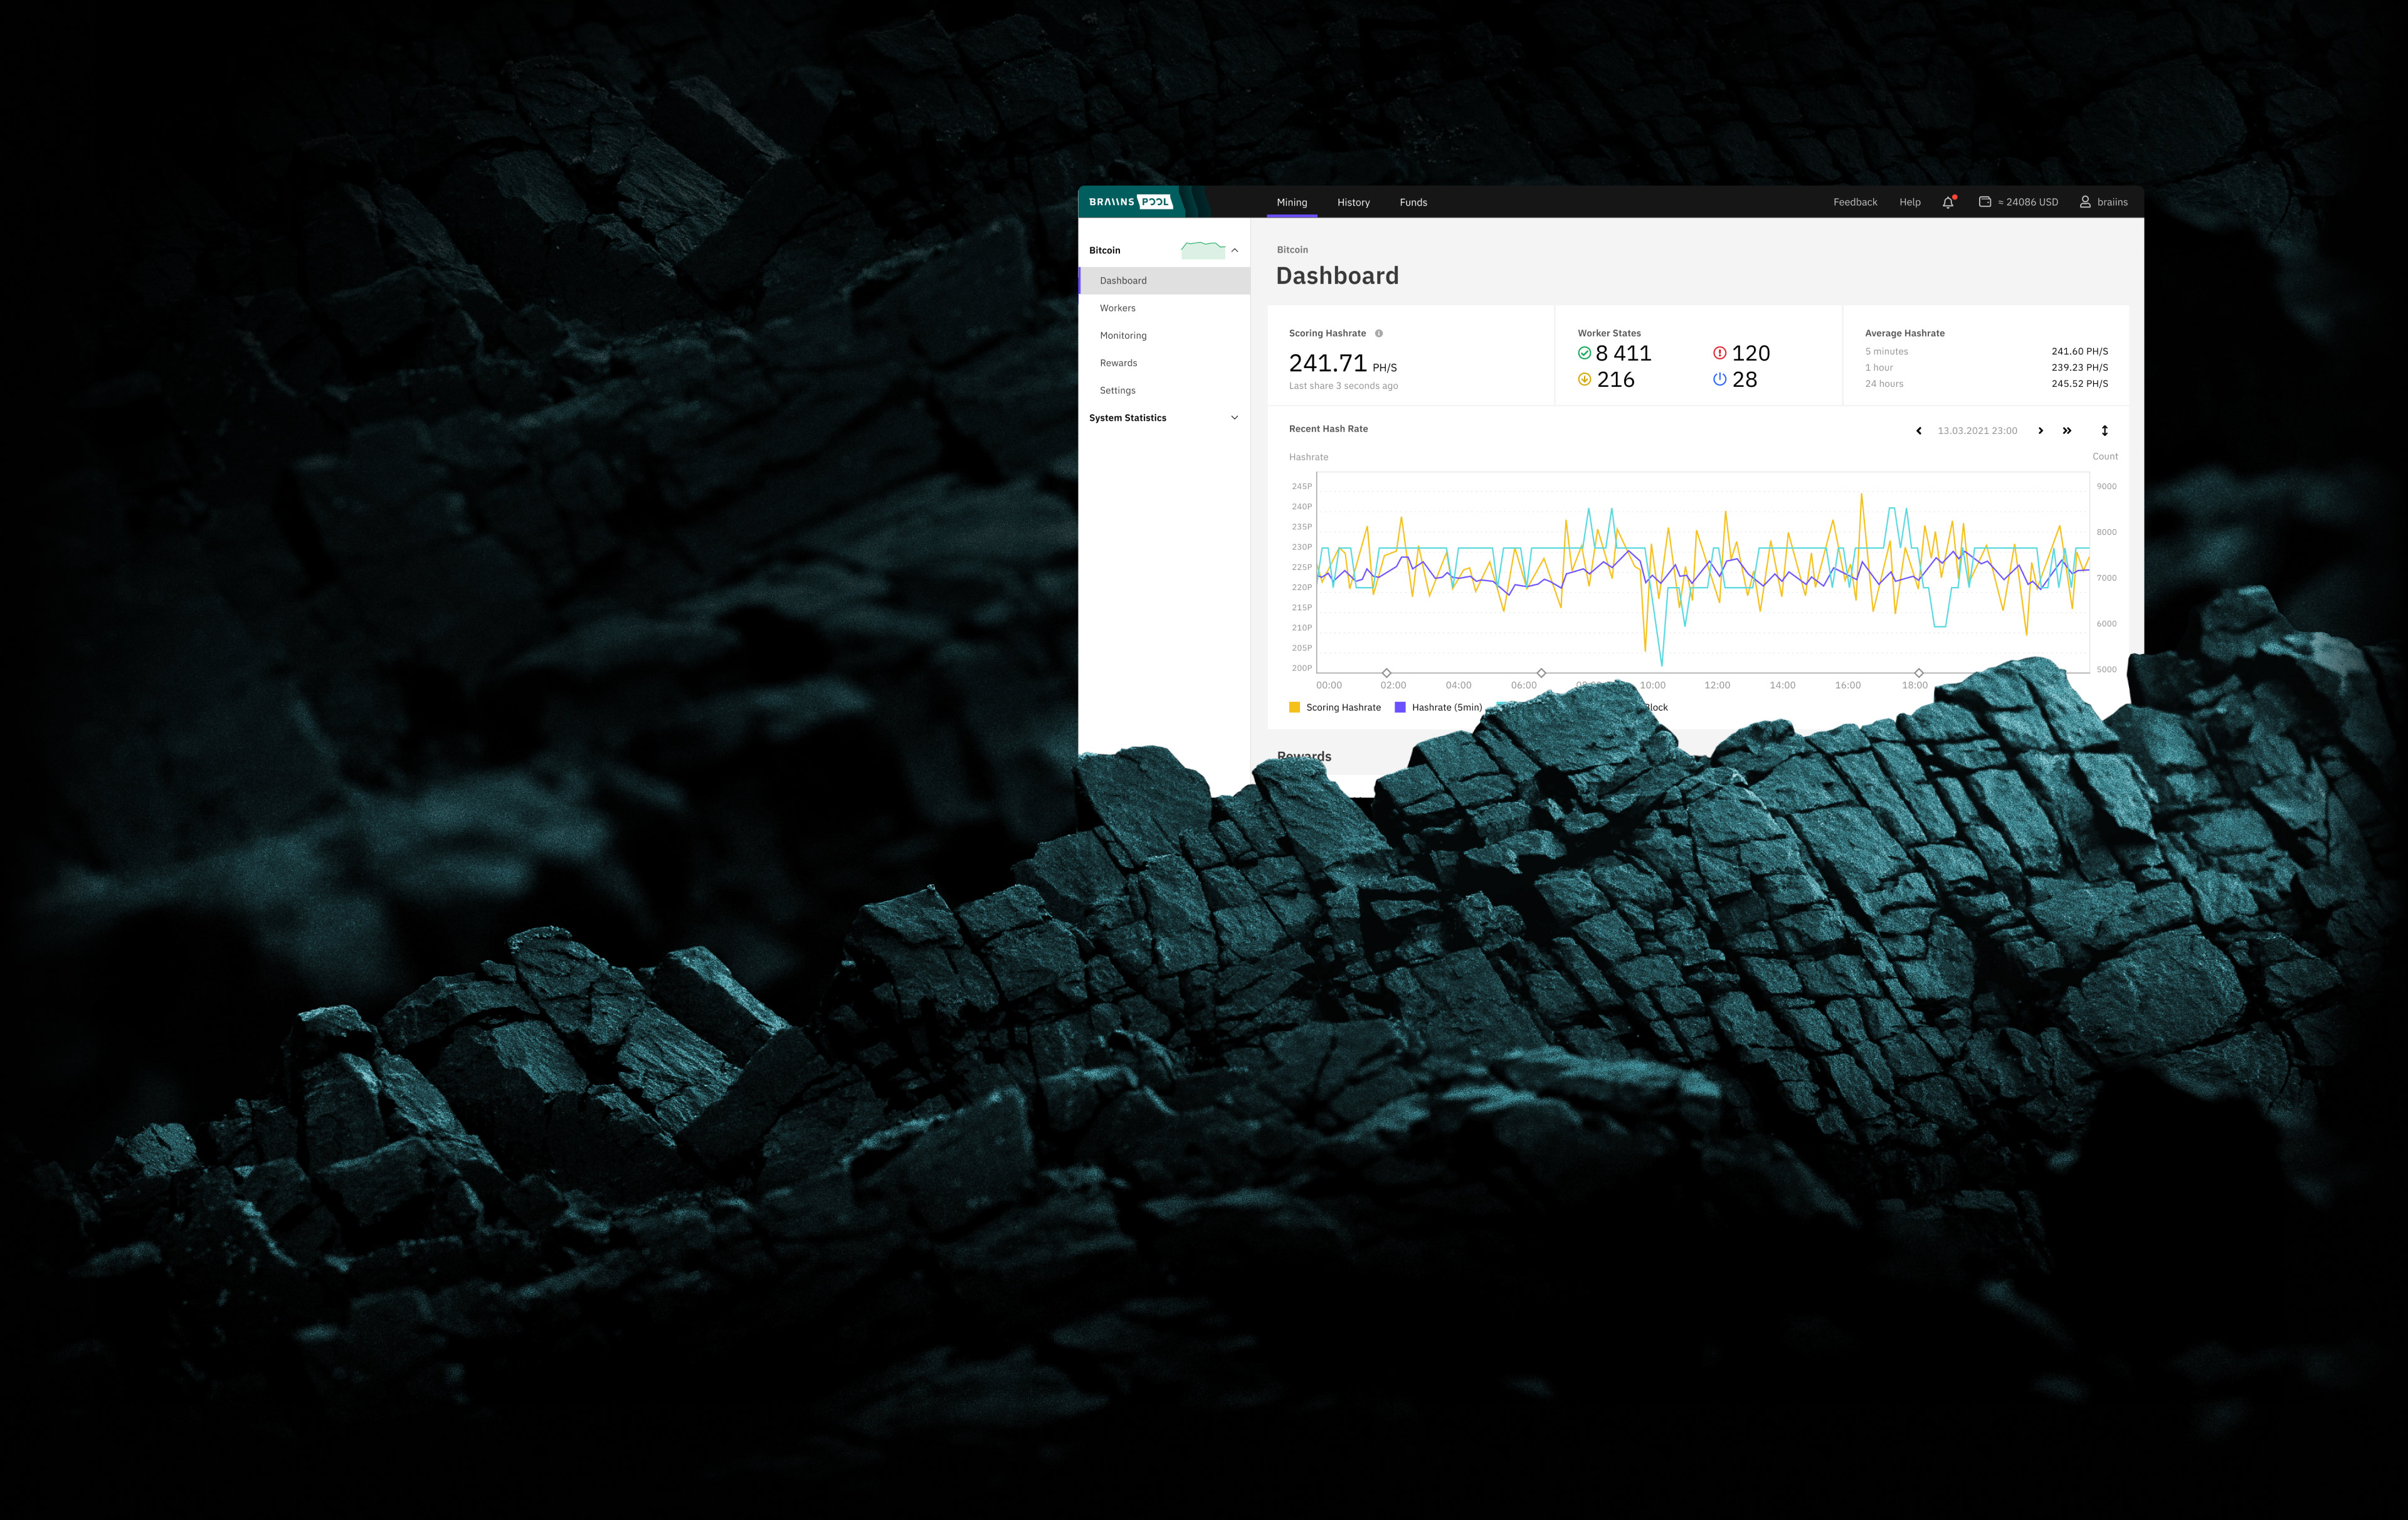

Increase hashrate on your Bitcoin ASICs, improve efficiency as much as 25%, and mine on any pool or get 0% pool fees on Braiins Pool.
.jpg)
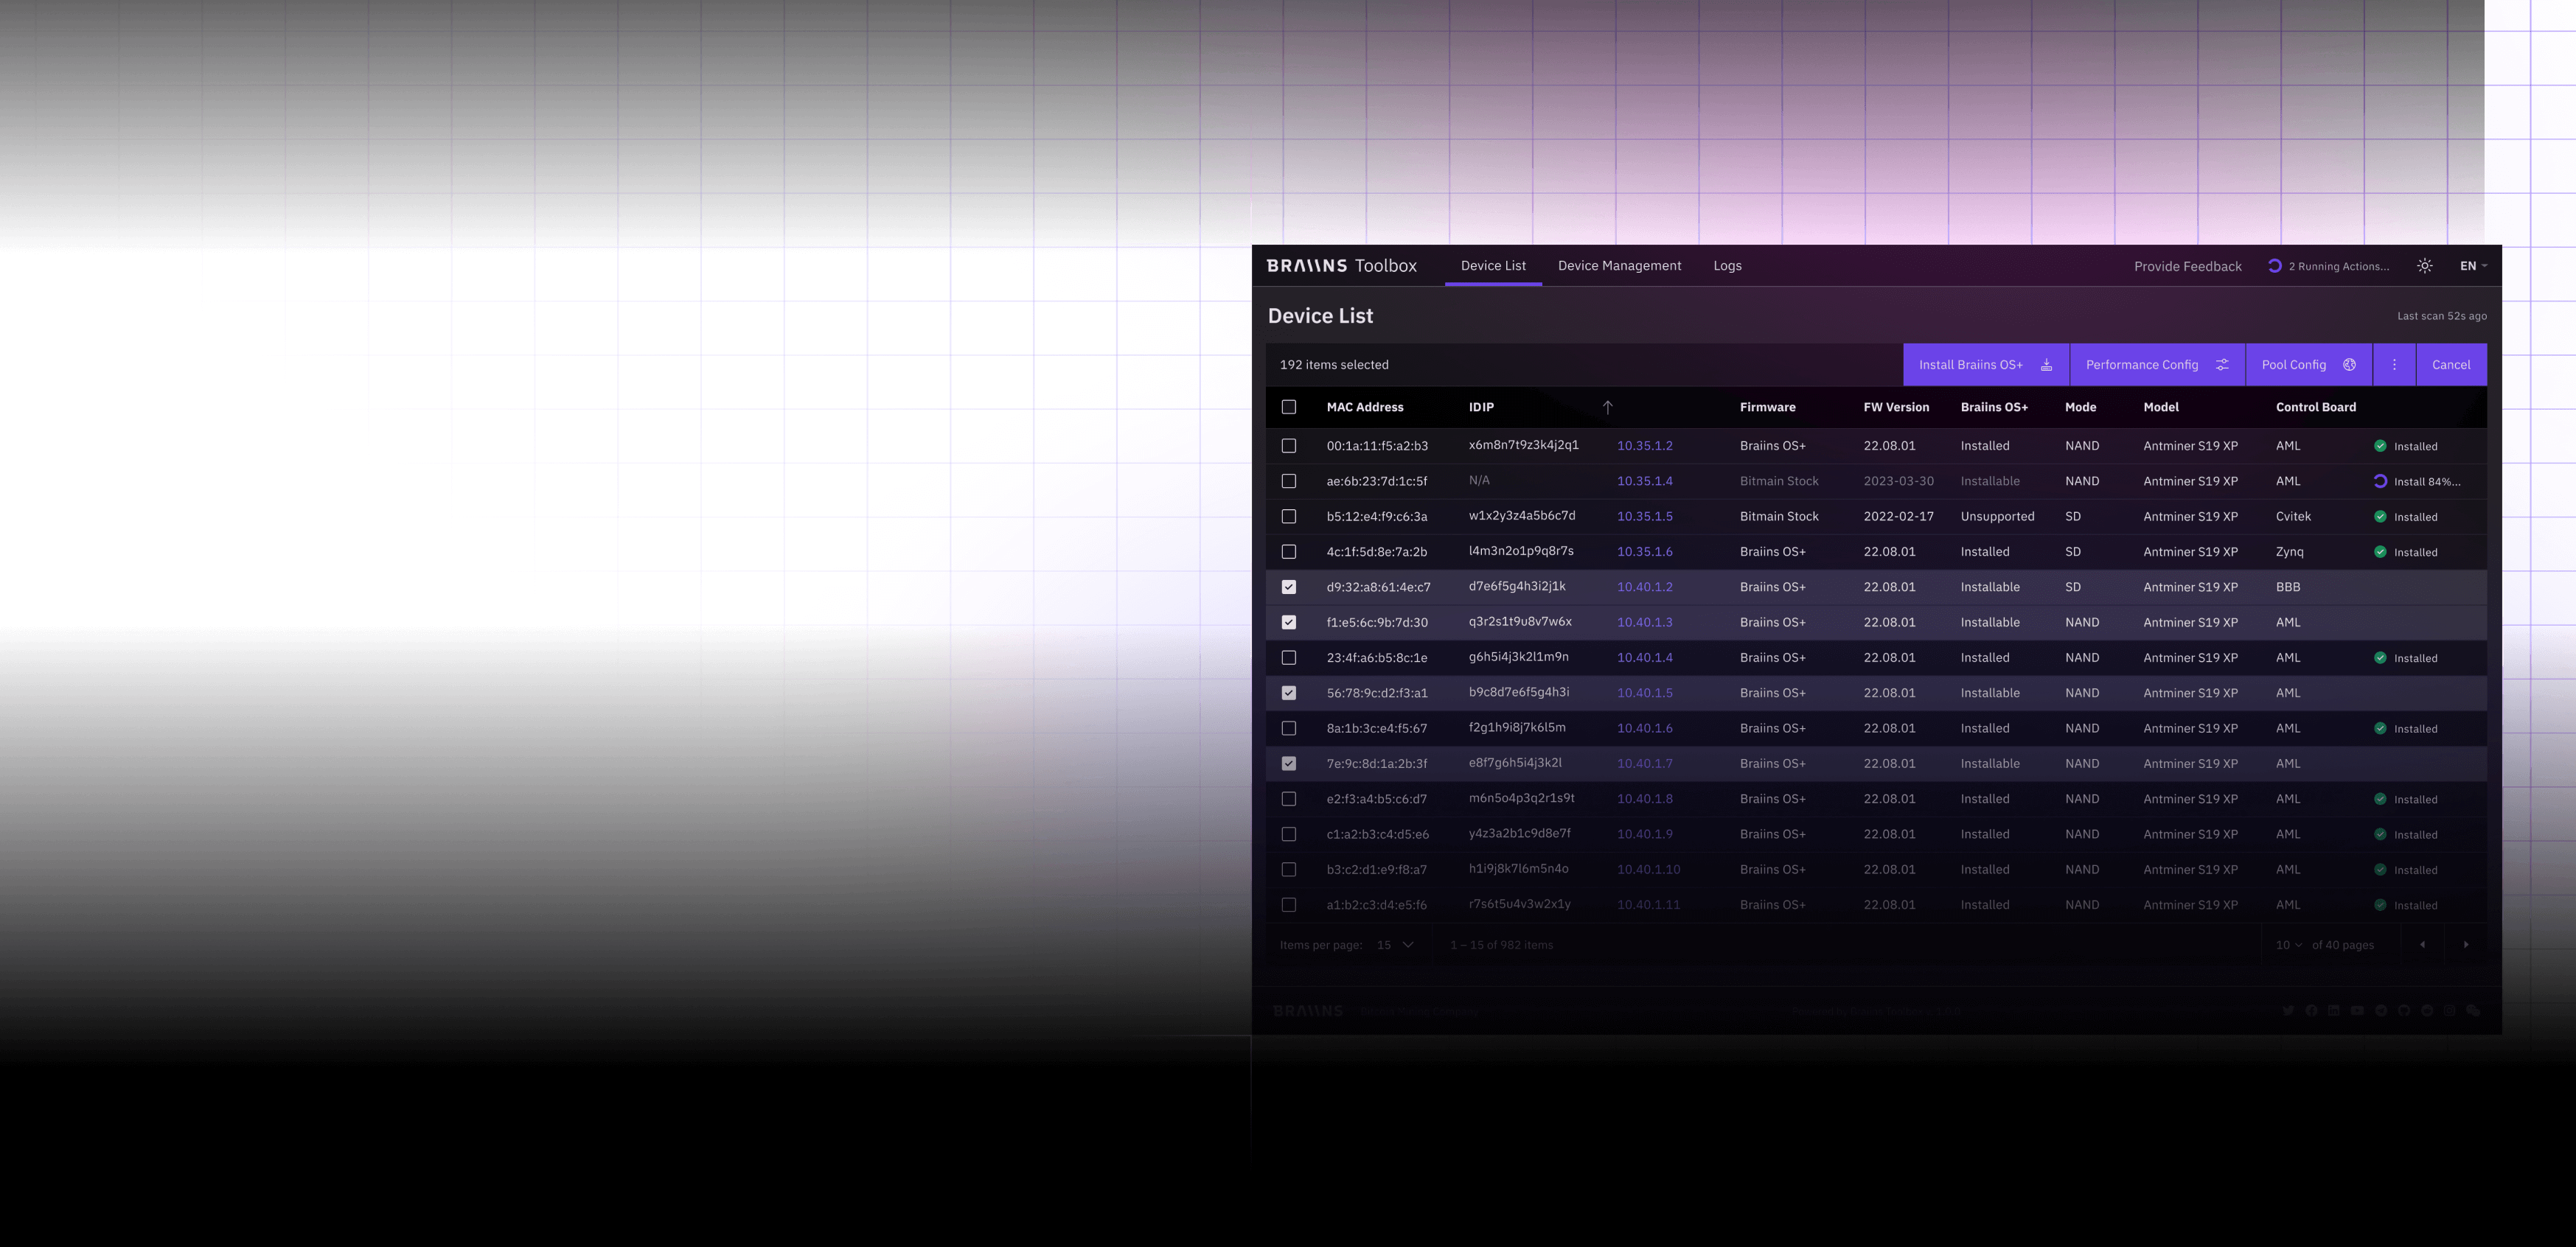
Do you want to easily make firmware updates, performance optimizations, and settings adjustments? Braiins Toolbox is here to optimize the way you manage your mining operation.
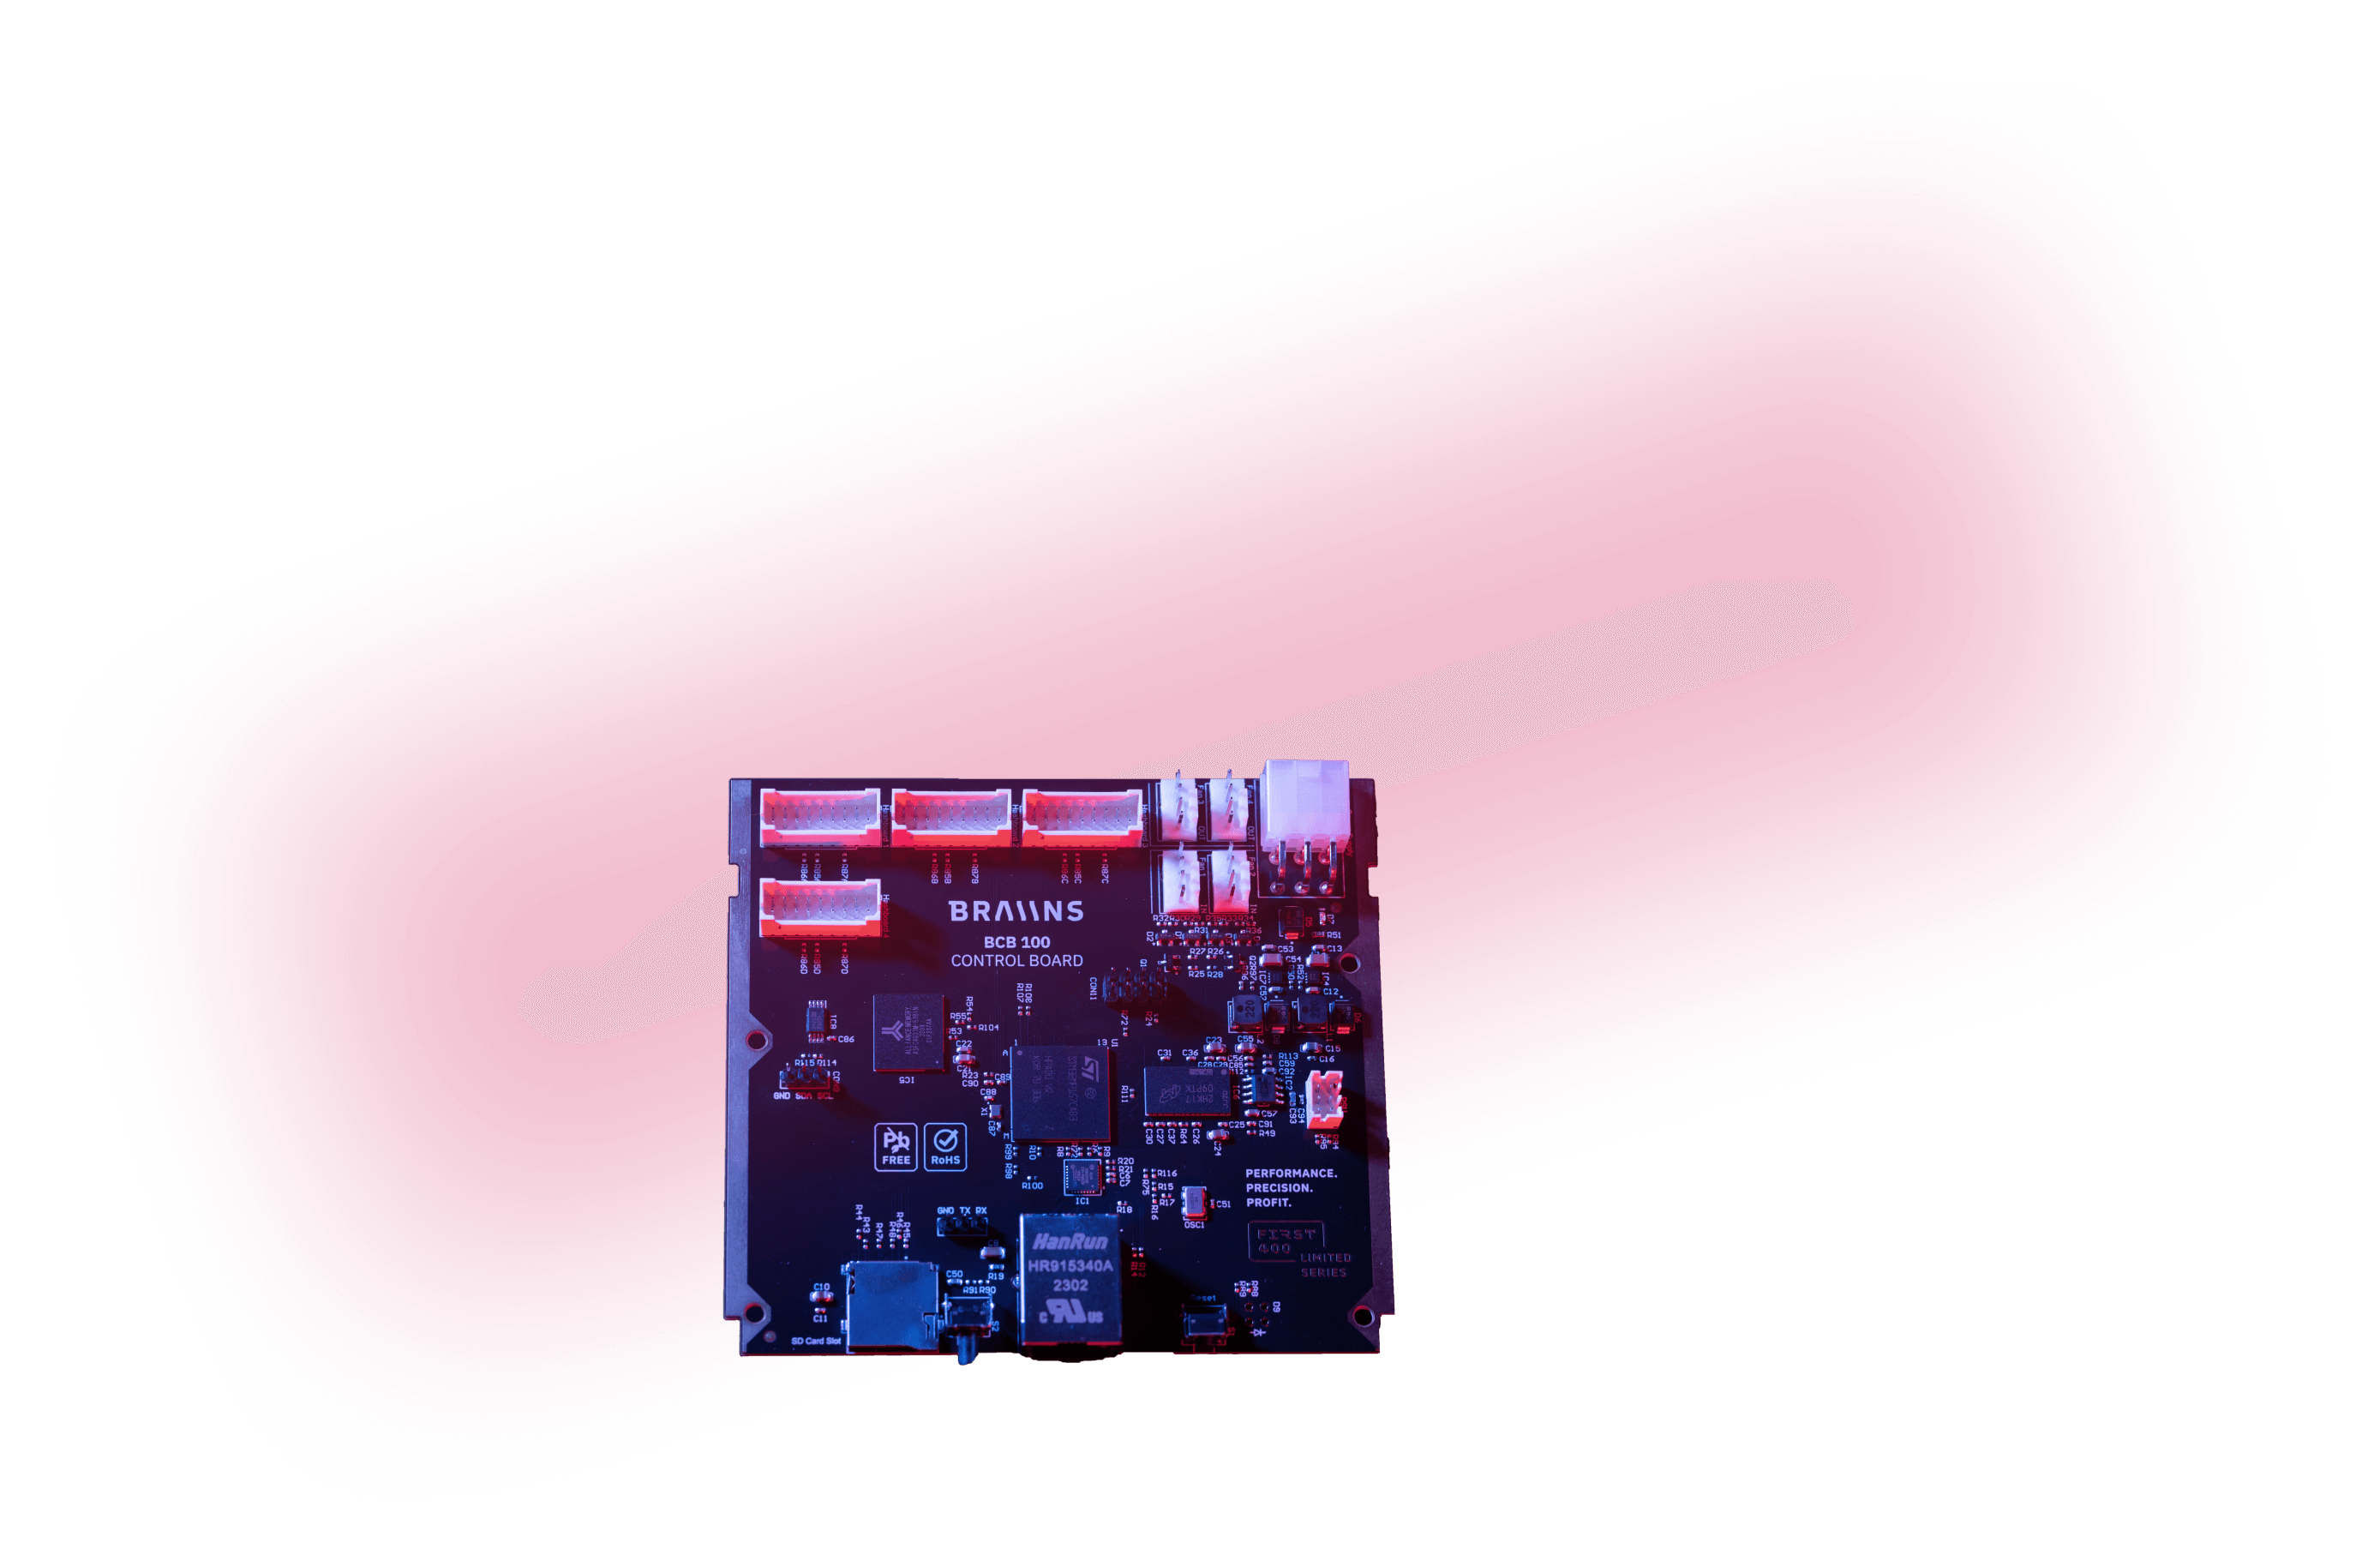
Bitcoin mining hardware designed in Europe, made to withstand the harshest mining environments.
Reduce data transmission between your farm and pool by 95%. Configure parallel usage of multiple pools. Set a backup pool for the whole farm.
.jpg)

Reduce internet data loads, improve security and privacy to prevent man-in-the-middle attacks, and benefit from improved flexibility and extensibility.
.jpg)


.svg)

